- Home
- Membership challenges
- Board reports
Board reports take days to pull together
Every quarter we lose most of a week to the board pack. We export from the membership database, the events system and finance, then try to make the numbers agree in a spreadsheet. By the time the board reads it, the figures are weeks old and say nothing about next quarter.
Does this sound familiar?
- The pack is rebuilt from scratch each quarter: the same exports, the same spreadsheet, the same broken formulas fixed again.
- Two reports give two different member counts, and part of the meeting goes on deciding which one is right.
- Only one person really knows how the pack is put together, so it stalls when they are on leave.
- The pack reports joiners, leavers and income for a quarter that has already ended. Nothing in it looks ahead.
- A trustee’s follow-up question, such as “which of our largest members renew next quarter?”, means another round of exports.
A typical case: a trade association’s board meets four times a year. Ten days before each meeting, the membership manager exports members, bookings and invoices from three systems, then spends two days matching names. At the meeting, the chair asks why the member count differs from last month’s newsletter, and nobody can say which is right.
The pack is assembled, not maintained
Each quarter starts again
The pack begins with fresh exports and a copy of last quarter’s spreadsheet. Every manual step is a chance for a figure to shift, and the steps are rarely written down.
Every figure has several sources
Members, events and invoices sit in different systems, each with its own idea of who counts as a member. The same company can be active in one and lapsed in another.
Nobody has agreed what the board needs
Packs grow over time. Each question a trustee once asked becomes a permanent table, so the pack gets longer without getting more useful.
Slow packs lead to slow decisions
- Senior staff time goes on assembly. Days each quarter are spent copying and checking figures instead of working with members.
- Board time goes on reconciling, not deciding. When two numbers disagree, the discussion turns to which is right.
- Renewal risk reaches the board as lost income. A count of leavers describes losses already made, too late to act on.
- Questions about member value go unanswered, because pulling engagement data together is a project in itself.
iMIS’s 2026 Membership Performance Benchmark surveyed over 400 membership professionals, mostly in the US. Only 43% said it is easy to access and understand their performance data. Another 39% said they “mostly have the data, but it takes effort to pull or analyze”. Source
Naylor’s 2026 Association Benchmarking Report surveyed 665 senior association professionals in North America. “Leveraging data for strategic decisions” entered its top three challenges for the first time, at 47.7%. Data and strategy remains the most understaffed area, at 38.5%. Source
In the UK, MemberWise’s Digital Excellence 2026 research, covering around 480 membership organisations, found that only 20% have a data strategy. Source
Five steps that work with any system
Agree a short, fixed set of measures
Choose the handful of figures the board actually uses to decide things. Write a one-line definition for each, such as who counts as a member and when, and ask the board to approve it.
Name one source for each measure
Decide which system owns each figure and take it from there every time. When two systems disagree, correct the data at source, not in the spreadsheet.
Build it once, then refresh it
Save the report, query or template behind each measure. Next quarter’s pack should be the same definitions run again on current data, not a rebuild.
Add leading indicators
Beside joiners, leavers and income, show what is coming: renewals due next quarter, income at risk and how many members are engaging. These give the board something to act on.
Keep the board view apart from the detail
The board needs trends and exceptions on a page or two. Keep the member-by-member lists for staff, and go to them when a trustee asks why a figure moved.
Saved reports, dashboards and exports from one system
Saved reports, dashboard widgets and exports all come from Colossus, so a board figure is run again each quarter, not rebuilt.
| What it does | How it works | Plans |
|---|---|---|
| Saved activity reports | A pivot table over the activity log, which records what was created, changed or deleted in the CRM, when and by whom. Count new accounts by month, or changes by their new value, in a live preview. Save the report with a name, description and tags, and run it again next quarter. | GrowthScale (advanced)Enterprise |
| Standard reports and exports | Excel export from the accounts grid, using the filters you have set, and from dashboard widgets. CSV export from other lists. | CoreGrowthScaleEnterprise |
| Custom dashboards | A drag-and-drop board of widgets built from saved reports, plus the At risk accounts widget. Each widget can be restricted to roles, so a board dashboard and a staff dashboard can sit side by side. | Growth (optional)ScaleEnterprise |
| At risk accounts widget | Counts the accounts your daily risk rules currently mark red, and optionally amber, for each product. Each figure opens the matching filtered accounts list. | ScaleEnterprise Configured during implementation |
| One source for every figure | Saved reports, widgets and exports all come from Colossus, not from separate spreadsheets, so each figure in the pack has one named source. | CoreGrowthScaleEnterprise |
Saved reports count activity in the period you choose. Current totals, such as accounts renewing next quarter, come from the filtered accounts list and its Excel export. The At risk accounts widget shows today’s position, so note its figure in each pack to build up the trend. Risk colours come from rules your team writes, not from a forecast.
How a trade association turned a week of exports into a refresh
Illustrative example. The Federation of Event Staging Contractors is a fictional trade association with 520 member companies and a membership team of three. This is a composite scenario, not a customer story.
Before each quarterly board meeting, the membership manager spent most of a week on the pack. She exported accounts, event bookings and invoices, matched them by hand and patched last quarter’s spreadsheet. Two different member counts had been circulating for a year.
The board agreed nine measures, each with a written definition and a named source. Measures of activity in the quarter, such as new member companies, became saved reports on a board dashboard, each widget restricted to the senior team. Staff kept a separate operational dashboard with the detailed lists.
Two leading indicators joined the pack: the At risk accounts count, and accounts renewing next quarter from the renewal dates on the accounts list. Preparing the pack became a refresh plus a page of commentary. When the chair asked which members were at risk, the answer was the filtered list behind the figure.
Turn the quarterly board pack into saved reports and a board dashboard
The Federation of Event Staging Contractors, a fictional trade association, wants its board figures run again each quarter instead of rebuilt from exports.
- Organisation
- Federation of Event Staging Contractors (fictional), 520 members
- Goal
- Build each agreed board measure once, from one named source, and show forward-looking figures beside the totals
- Takes
- About 85 seconds, 7 steps
- Plan
- Scale and Enterprise plans (saved reports are also on Growth)
A walkthrough of real Colossus screens with a fictional organisation and demonstration data. Your own set-up, fields and wording will differ.
-
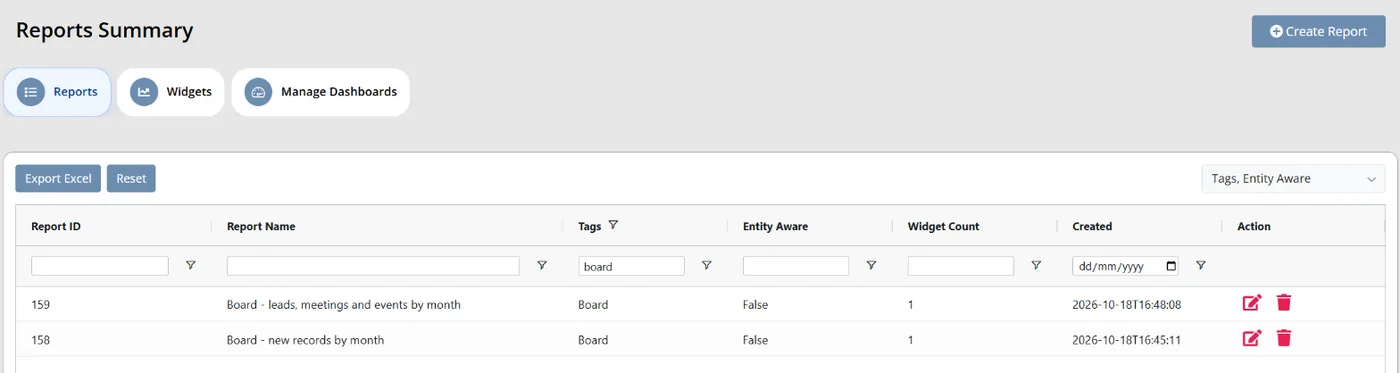
Colossus screen, demonstration data Step 1 of 7Start from the saved reports
What you do: Open Analytics > Reports and filter the Tags column to Board.
What to notice: Each saved report keeps its name, description and tags, so the board set is easy to find every quarter.
-
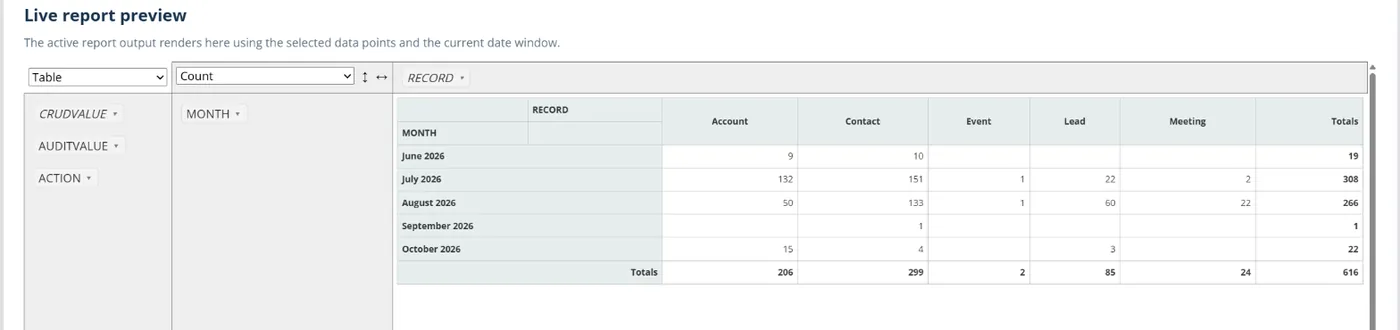
Colossus screen, demonstration data Step 2 of 7Build a measure once
What you do: Choose the data points for one measure, such as Month, Record, CRUD Value and Audit Count for records created each month, then arrange them in the live preview.
What to notice: The Report Builder reads the activity log, so its measures count what was created, changed or done. The definition lives in the saved report, not in one person's spreadsheet.
-
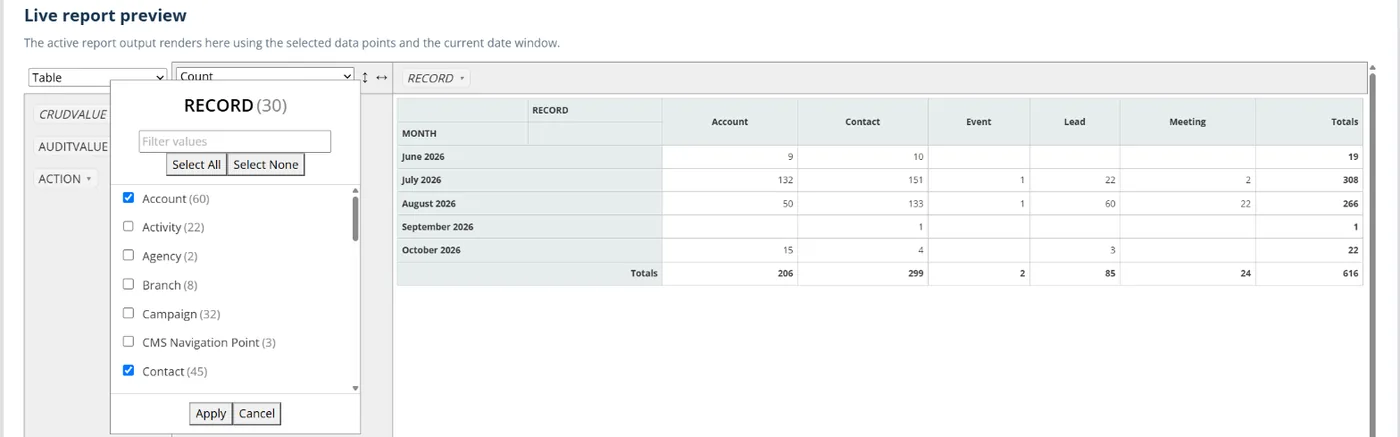
Colossus screen, demonstration data Step 3 of 7Apply the agreed definition
What you do: Filter the fields in the live preview to match the board's written definition, then save the report with a 'Board' tag.
What to notice: Anyone who opens the report gets the same figure, because it reads the same activity log.
-
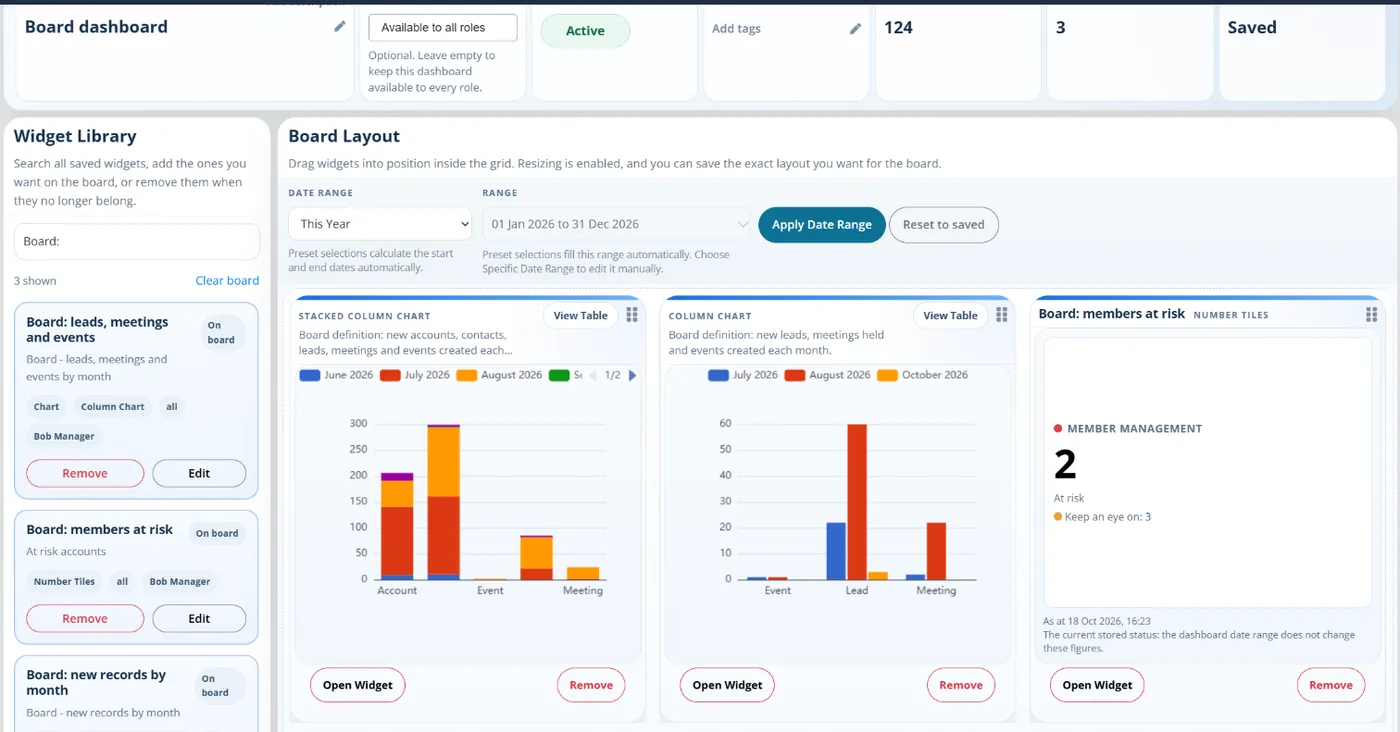
Colossus screen, demonstration data Step 4 of 7Lay out the board dashboard
What you do: Make a widget from each saved board report in Analytics > Widgets, then create a board dashboard in Manage Dashboards and drag the widgets in from the Widget Library in the order of the pack.
What to notice: The dashboard is the board view: a short set of measures, not the operational detail.
-
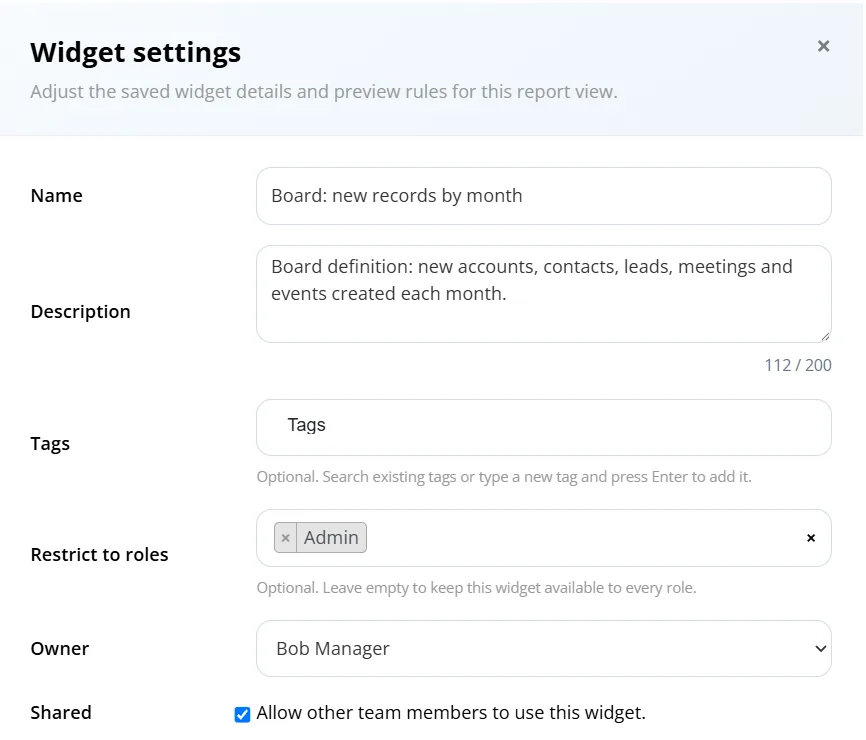
Colossus screen, demonstration data Step 5 of 7Keep the board view separate
What you do: In each widget's settings, use Restrict to roles to limit it to the senior team's role.
What to notice: Staff keep their own operational dashboard with the detailed lists, side by side with the board view.
-
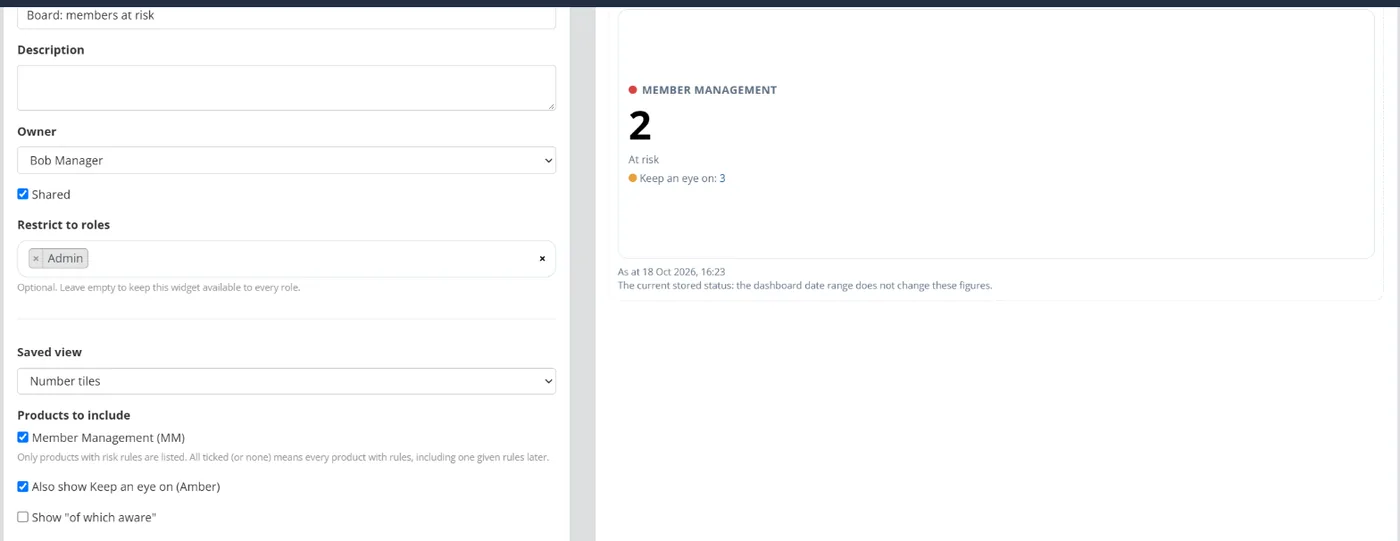
Colossus screen, demonstration data Step 6 of 7Add a forward-looking figure
What you do: Add an At risk accounts widget to the board dashboard and tick Also show Keep an eye on (Amber).
What to notice: Each count opens the filtered accounts list behind it, so a trustee's question is answered from the record.
-
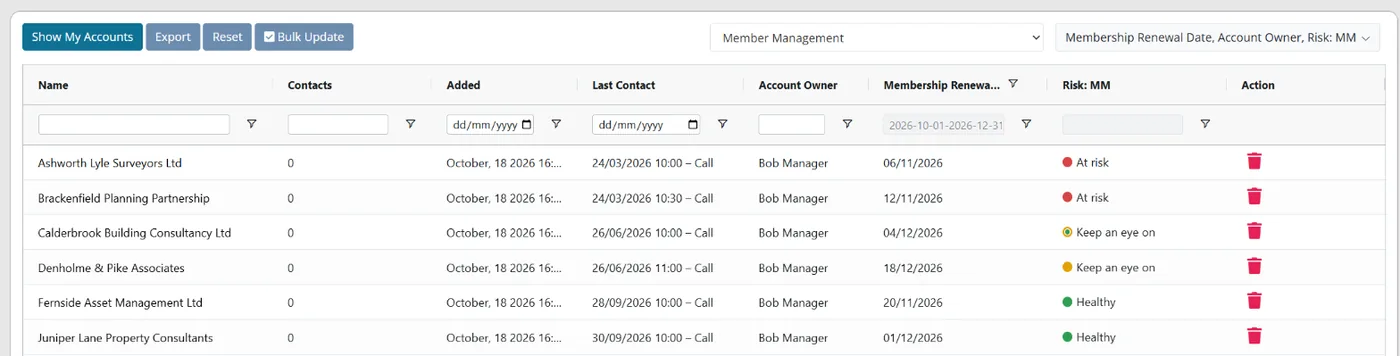
Colossus screen, demonstration data Step 7 of 7Export the detail for the appendix
What you do: Filter the accounts grid to the board's definition and click Export.
What to notice: The export uses the filters set on the grid, so the appendix lists the same accounts the board definition counts.
The result
The board dashboard shows the agreed measures from saved reports, with the At risk accounts count beside them. Next quarter the team opens the same reports and dashboard on current data instead of starting again.
What to measure
Measure the reporting process itself over two or three board cycles, against your own starting point. The aim is a pack that is quicker to prepare, trusted at the meeting and more useful for decisions.
- Staff hours per board packHours from the first export to the pack being sent, recorded every quarter.Lower is better
- Figures adjusted or disputedMeasures corrected by hand, or questioned at the meeting because two sources disagreed.Lower is better
- Measures with a definition and one sourceThe share of board measures that have both a written definition and a named source.Higher is better
- Leading indicators in the packMeasures that look ahead, such as renewals due and accounts at risk, against those that look back.A balance of both is the aim
- Age of the figures at the meetingDays between the date the data was taken and the day the board reads it.Lower is better
Frequently asked questions
How many measures should a board pack have?
Which leading indicators should a membership board see?
What should we do when two figures still disagree?
Can Colossus produce the whole board pack?
Which Colossus plans include saved reports and custom dashboards?
Sources
- iMIS (ASI), 2026 Membership Performance Benchmark Report, 11th edition, findings as summarised on the iMIS blog. Over 400 membership professionals surveyed in late 2025; global, mostly in the US.
- Naylor Association Solutions, 2026 Association Benchmarking Report, 15th edition, August 2026. 665 senior association professionals in North America.
- MemberWise, Digital Excellence Report 2026. Around 480 UK membership organisations; findings as summarised by research partner Cantarus.
See where your own systems stand
The Membership Systems Health Check is ten multiple-choice questions about your data, renewals, automation, reporting and member experience. You get your score out of 100 on screen straight away, with no email needed to see it.
Prefer to talk it through? Book a tailored demonstration and we will start from this problem, not a feature tour.