Turn Membership Satisfaction Scores (4–5 = Satisfied) Into Renewals

A membership satisfaction score is a metric that shows how happy members feel about their experience with your organisation, usually calculated as the percentage who rate their satisfaction 4 or 5 on a 5-point scale. It works like a CSAT score in retail: count the satisfied responses, divide by total valid responses, multiply by 100. Membership teams track it to spot shifts in member experience before those shifts show up as lost renewals.
TL;DR:
- Member satisfaction scores are narrow indicators that detect experience gaps but should be supplemented with multiple metric types for clarity.
- Consistent survey wording, proper question placement, and broad, voluntary sampling are crucial for reliable trend analysis and meaningful benchmarks.
- Satisfaction and renewal are related but distinct, requiring separate tracking to accurately gauge member loyalty and retention risks.
- Linking survey results with renewal and usage data within a unified platform enhances segmentation and accelerates responsive improvements.
- Focus efforts on resolving issues for high-value segments first, as their departure costs more than minor complaints from casual or less engaged members.
Table of Contents
- What the score measures and how it differs from other metrics
- How to calculate a CSAT-style membership satisfaction score
- Survey design: order, labels, sampling and follow-ups
- Interpreting scores: why benchmarks can mislead
- Turning results into action: prioritisation and testing
- How an integrated platform supports satisfaction measurement
- Common pitfalls and where to focus limited resources
- Run your own satisfaction measurement with Colossus Systems
- FAQ
- Sources
What the score measures and how it differs from other metrics
A satisfaction score captures the gap between what members expected and what they actually experienced, nothing more. That makes it a useful early signal, but a narrow one. Three common variants show up in membership research, each suited to a different question:
- CSAT-style percentage: the share of respondents choosing 4 or 5 on a satisfaction scale, best for tracking change over time.
- Mean rating: the average score across all responses, useful for comparing dimensions like events, communications or support.
- Net Promoter Score: measures willingness to recommend, which taps loyalty rather than experience.
A single satisfaction question carries real limitations. Federal survey design guidance warns that mean ratings drawn from one scale can have low reliability, and recommends pairing the headline question with several dimension questions covering service quality, events and digital experience. That combination tells you not just how members feel, but which part of the experience is driving the feeling.
How to calculate a CSAT-style membership satisfaction score
The calculation itself is simple once the question is worded consistently. Qualtrics’ CSAT guidance recommends a standard overall question, such as “How satisfied are you with your membership overall?”, answered on a labelled 1 to 5 scale (very dissatisfied to very satisfied).
- Collect valid responses, excluding incomplete or skipped surveys.
- Count how many respondents selected 4 or 5.
- Divide that count by the total number of valid responses.
- Multiply by 100 to get your satisfaction percentage.
Statistic: Reporting the percentage of satisfied members alongside the mean score, with the scale and satisfied threshold disclosed, gives readers enough context to judge whether a change in the headline number reflects a real shift or a scoring quirk, a practice Qualtrics recommends for any CSAT-style metric.
Say some members respond and a proportion pick 4 or 5: the satisfaction score is their ratio expressed as a percentage. Always state which scale you used and what counts as “satisfied”, since a 4-point scale and a 5-point scale are not directly comparable.
Survey design: order, labels, sampling and follow-ups
The order and wording of your questions shape the answers you get, sometimes more than the actual member experience does. NAR’s quick start guide recommends asking the overall satisfaction question first, while it is still top of mind and unbiased by anything that follows, then adding dimension questions on value, events, communications and support, and closing with an open-ended “what’s the main reason for your rating?” prompt.
A few design habits protect the validity of what you collect:
- Keep wording and scale labels identical every time you run the survey, so results stay comparable.
- Run a full relationship survey annually, supplemented by short pulse surveys after events or renewals.
- Sample broadly enough to represent different member types, not just your most engaged respondents.
- Make participation voluntary, explain how responses will be used, and allow members to skip sensitive questions, a practice the AMA’s framework for customer satisfaction recommends to protect confidentiality and response quality.
Pro Tip: Place the open-ended “reason” question immediately after the rating question, not at the end of the survey, so the comment stays tied to that specific score rather than to the survey experience as a whole.
Interpreting scores: why benchmarks can mislead
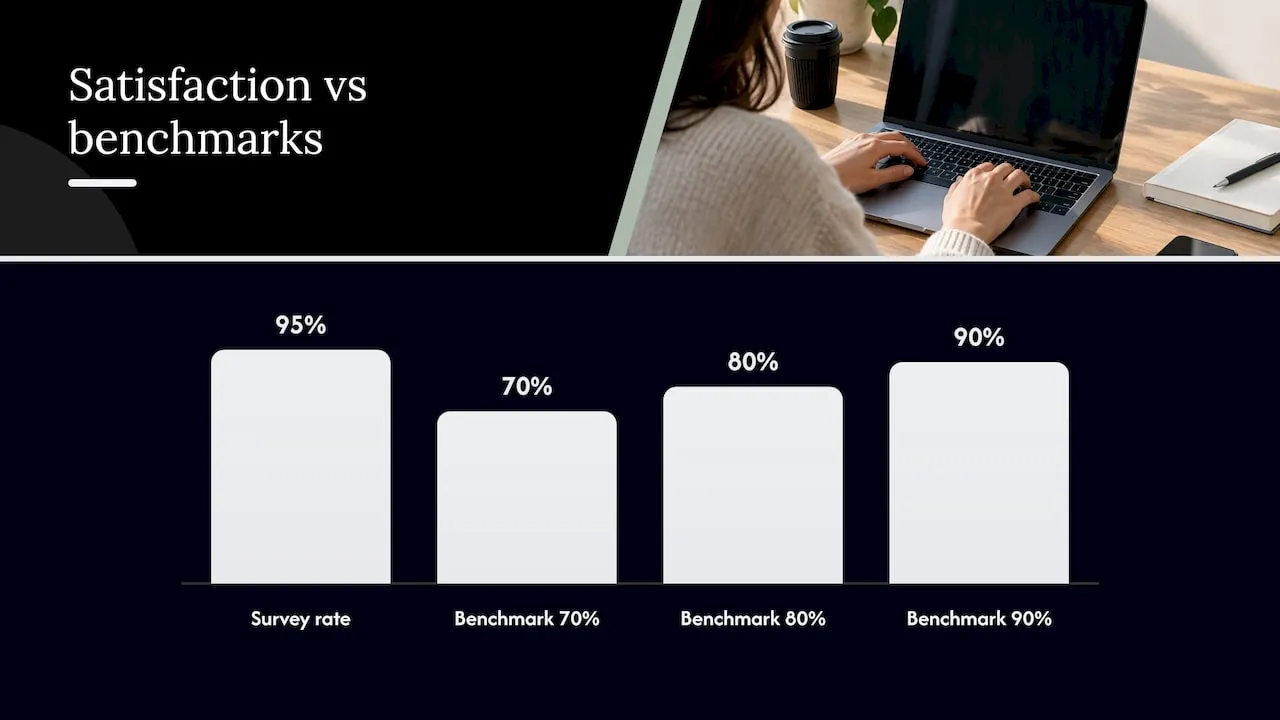
There is no universal “good” membership satisfaction score. Research on member surveys notes that satisfaction often runs above 95% even in organisations where actual retention is far lower, which makes an imported benchmark (70%, 80%, 90%) close to meaningless unless the comparison population and methodology match yours closely.
What matters more than any fixed threshold:
- Your own baseline and how the score moves year over year.
- Differences between segments: new members versus long-tenured ones, event attendees versus non-attendees.
- Whether satisfaction tracks with actual renewal, not just stated intent to renew.
- Complementary indicators such as usage data and renewal rate, which round out a picture that a single score cannot give alone.
Satisfaction and loyalty are not the same thing. The same member survey guidance is explicit that satisfied members still lapse, so renewal intent and observed renewal deserve their own tracking line rather than being assumed from a satisfaction figure. Our KPI guide for membership organisations walks through how to set these indicators side by side.
Turning results into action: prioritisation and testing
A score only earns its place on a dashboard once it changes something. The open-text responses from your survey are where the real work starts, because they tell you why a rating landed where it did, not just that it did.
- Sort open-text comments into themes, then split those themes into quick wins (a confusing portal menu, slow event sign-up) and strategic projects (pricing structure, benefit mix).
- Pilot a fix with a small cohort, measure satisfaction and renewal before and after, and only roll it out organisation-wide once the pilot shows a real effect, a sequence we cover in more detail in our guide to improving member retention.
- Report back to members on what changed because of their feedback, which tends to improve response rates on the next survey.
Keeping a record of which interventions moved the needle, and which didn’t, turns satisfaction tracking into a feedback loop rather than an annual report nobody reads twice. Our piece on proven strategies for improving member satisfaction maps common drivers to the fixes that tend to address them.
How an integrated platform supports satisfaction measurement
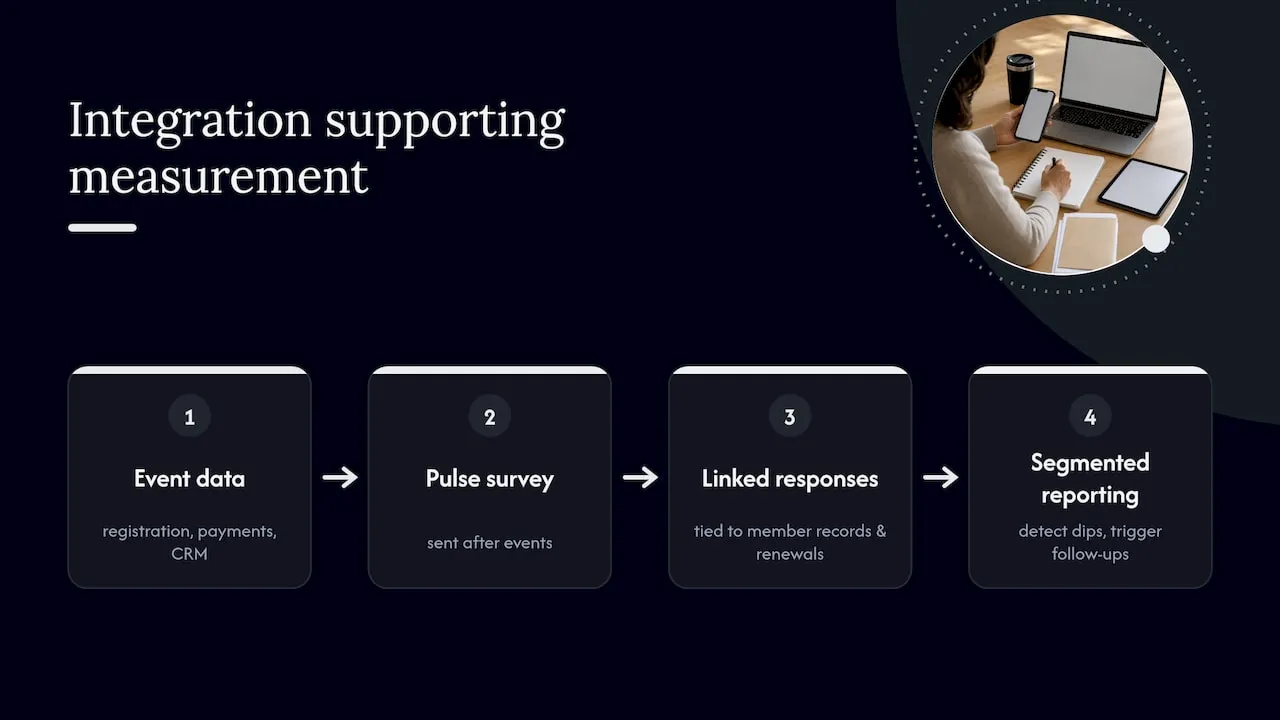
Collecting, segmenting and reporting a membership satisfaction score is far easier when the survey sits inside the same system as your member records and event data. Our platform lets organisations send pulse surveys after events, trigger follow-up prompts from the member portal, and tie every response back to that member’s renewal history automatically.
Because registration, payments and CRM data live in one place, a satisfaction dip among a specific segment, say, members who attended a particular event, shows up in reporting without manual cross-referencing. Our features page covers the analytics and automation tools that support this kind of segmented reporting, and our event management software handles the registration and payment side that feeds those event-linked scores.
Common pitfalls and where to focus limited resources
The mistake we see most often is changing question wording or timing between survey waves, which quietly destroys comparability just when teams need it most. A close second is treating a high satisfaction score as proof that renewal is safe, when the two can diverge sharply.
With limited time, fix the issues affecting your largest or highest-value segments first. A small complaint from a handful of casual members matters less than a recurring one from long-tenured or committee-level members, whose departure costs far more to replace.
— Rob
Run your own satisfaction measurement with Colossus Systems
Measuring satisfaction well means collecting feedback consistently, segmenting it properly and connecting it to renewal data, which is exactly where separate survey tools and spreadsheets start to break down. Our membership management platform keeps surveys, member records, event attendance and CRM data together, so a satisfaction score never sits in isolation from the behaviour it’s meant to explain.
- Build pulse surveys and portal prompts without a separate survey tool.
- Segment results by member type, tenure or event attendance automatically.
- Link satisfaction trends directly to renewal and usage data for each member.
If you’re ready to see how this works for your organisation, check our membership management software or view plans and pricing to find the right fit.
FAQ
What is the definition of a customer satisfaction survey?
A customer satisfaction survey asks respondents to rate their experience with a product, service or organisation, typically on a numbered scale. For membership organisations, the same format is used to ask about overall membership experience rather than a single transaction.
What is CSAT and how does it relate to KPIs?
CSAT is a customer satisfaction score calculated as the percentage of respondents who rate their experience as satisfied, usually a 4 or 5 on a 5-point scale, as described in Qualtrics’ CSAT overview. As a KPI, it should be tracked alongside behavioural data like renewal rate rather than treated as a stand-alone measure of organisational health, per the AMA’s framework.
How is a customer satisfaction index score calculated?
Approaches vary, but a common version averages several rating questions, such as overall satisfaction, value and service quality, into a single composite figure rather than relying on one question. Definitions of the exact index differ between organisations, so check how any published figure was constructed before comparing it to your own.
How do you measure member satisfaction levels effectively?
Ask a consistent overall satisfaction question on a labelled scale, add a short open-ended reason question, and repeat the same wording at regular intervals, a structure recommended in NAR’s measurement guide. Compare results across segments and against renewal behaviour rather than against an external benchmark.
What factors most affect membership satisfaction scores?
Scores typically move with perceived value for money, event quality, communication frequency and clarity, and the ease of digital tools like a member portal. Survey design choices themselves, including question wording and scale labels, can also shift results, so the federal survey design manual recommends keeping these fixed between survey waves.
Sources
- What is CSAT? | Qualtrics
- Measuring member satisfaction: a quick start guide | NAR
- Guide to member surveys
- Customer satisfaction: an organising framework for strategy | AMA
- Resource manual for customer surveys (U.S. federal guidance)