Key performance indicators for membership organisations

The most important key performance indicators for membership organisations cover five domains: financial health (turnover, profit, monthly recurring revenue), member acquisition (growth rate, conversion rate, acquisition cost), retention (churn rate, renewal rate, average membership duration), engagement (visit frequency, event attendance, benefit utilisation), and satisfaction (Net Promoter Score, qualitative feedback). Track all five consistently and you have a complete picture of your organisation’s health.
According to Membership Geeks, 14% of membership site owners track no KPIs at all. That figure should alarm any serious membership leader, because without measurable benchmarks, decisions default to instinct rather than evidence.
Table of Contents
- Which key performance indicators should every UK membership organisation track?
- Why KPIs matter for membership organisations
- Core KPIs for membership growth and financial health
- How to measure member retention and lifetime value
- Member engagement KPIs and satisfaction measurements
- How Colossus helps UK membership organisations track and act on KPIs
- Why trial retention deserves its own KPI
- Colossus gives your membership organisation a measurable edge
- Key takeaways
Which key performance indicators should every UK membership organisation track?
The metrics below form the foundation of any credible membership performance analysis. Use this list as your starting audit:
- Turnover and profit — total revenue minus operating costs; the baseline for financial viability
- Membership growth rate — net new members as a percentage of your total membership base
- Churn rate — the percentage of members who cancel within a given period
- Customer Lifetime Value (CLV) — the total revenue a member generates across their entire relationship with your organisation
- Member Acquisition Cost (MAC) — total spend on recruitment divided by new members gained
- Conversion rate — the proportion of prospects or trial participants who become paying members
- Renewal rate — first-year and multi-year renewals tracked separately
- Member engagement score — a composite of visit frequency, event attendance, and benefit utilisation
- Net Promoter Score (NPS) — how likely members are to recommend your organisation to a peer
- Average membership duration — the mean length of an active membership
- Member reactivation rate — lapsed members who return within a defined window
- Member referral rate — new members attributed to existing member recommendations
- Event attendance rate — percentage of members attending at least one event per year
- Average time to onboard new members — days from sign-up to first meaningful engagement
Why KPIs matter for membership organisations
KPIs are quantifiable benchmarks that tell you whether your membership programme is moving in the right direction. For a professional association or charity, that matters more than it might for a transactional business, because membership is a relationship, not a one-off purchase. A member who feels undervalued simply does not renew.
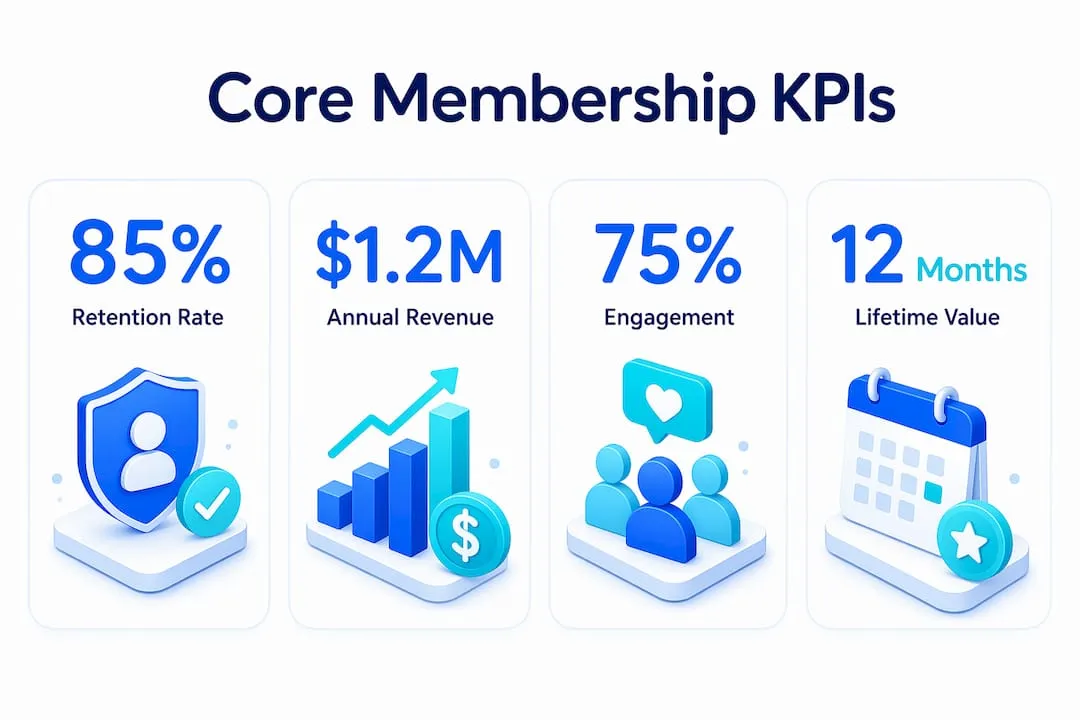
Consistent tracking of revenue, renewals, event attendance, and satisfaction improves decision-making and prevents stagnating membership numbers. The discipline of reviewing data regularly forces leadership teams to confront uncomfortable truths early, before a retention problem becomes a financial crisis.
Two practices sharpen KPI tracking considerably:
- Segmentation by membership type — a corporate member and an individual member have different renewal drivers. Tracking churn across both groups as a single number masks the real story. Segment by tier, geography, or join date to surface patterns that aggregate data hides.
- Benchmarking against peer organisations — your churn rate means little in isolation. Comparing it against sector averages or similar-sized UK bodies gives it context. Membership bodies such as the Association of Association Executives publish sector benchmarks that provide a useful reference point.
Pro Tip: Set a fixed monthly KPI review date and circulate a one-page dashboard to your leadership team before the meeting. Organisations that review data on a schedule make faster, more confident decisions than those that pull reports reactively.
Core KPIs for membership growth and financial health
Growth and financial sustainability are two sides of the same coin. An organisation that recruits aggressively but spends more per member than it earns is not growing; it is borrowing against its future.

The top KPIs used by membership-driven organisations globally include total active members, membership revenue, and new members acquired per month or year. These three figures, tracked together over time, reveal whether your recruitment engine is working and whether your pricing holds up.
Key metrics to monitor in this domain:
- Membership growth rate — calculated as (new members minus lapsed members) divided by total members at the start of the period, expressed as a percentage. A positive rate confirms net growth; a flat or negative rate demands investigation.
- Revenue from membership dues — split between new sign-ups and renewals. If renewal revenue is declining while new sign-up revenue holds steady, your retention is eroding beneath a recruitment mask.
- Revenue from fundraising and events — for charities and nonprofits, these income streams often dwarf dues. Track them separately so you understand which activities drive financial health.
- Member Acquisition Cost — tracking acquisition costs against growth is vital for sustainable expansion. If your MAC rises quarter on quarter, your marketing channels are becoming less efficient.
- Conversion rate by channel — linking web analytics with CRM data gives you detailed conversion tracking by medium, campaign, or audience segment. A paid social campaign converting at 0.8% versus an email nurture sequence converting at 4.2% tells you exactly where to invest.
- Monthly Recurring Revenue (MRR) — for organisations with rolling monthly memberships, MRR is the clearest indicator of financial momentum.
- Revenue by membership tier — understanding which tiers generate the most income informs pricing decisions and helps you identify where to focus retention effort.
How to measure member retention and lifetime value
Retention is where most membership organisations either build long-term financial strength or quietly bleed it away. A member who renews for five years is worth dramatically more than one who cancels after twelve months, and the cost of replacing a lapsed member almost always exceeds the cost of keeping an existing one.
Renewal rates differentiate between short-term and long-term member loyalty. Track first-year renewals separately from multi-year renewals; members who survive their first anniversary are significantly more likely to stay for the long term.
Retention KPIs to monitor:
- Churn rate — the percentage of members who cancel in a given period. Monthly churn compounds quickly; even a 3% monthly rate translates to over a third of your membership lost in a year.
- First-year renewal rate — the single most predictive indicator of programme health. A low first-year renewal rate signals a gap between what you promised at sign-up and what members actually experienced.
- Multi-year renewal rate — members renewing for a third or fourth consecutive year are your most loyal cohort. Protect them with targeted communications and exclusive benefits.
- Average membership duration — the mean time members stay active. Pair this with CLV to understand the financial value of improving retention by even a few months.
- Customer Lifetime Value — multiply average monthly revenue per member by average membership duration. This figure justifies your acquisition spend and guides decisions about member benefits investment.
- Member reactivation rate — lapsed members who return are cheaper to win back than cold prospects. Track what percentage of lapsed members you successfully reactivate, and which reactivation campaigns perform best.
- Member referral rate — members who refer peers are your highest-value cohort. They cost nothing to acquire and tend to stay longer. Segment your referral data to understand which member types refer most actively.
- Segmentation by demographics — retention patterns often differ by age group, geography, or membership tier. A blanket retention strategy misses these differences; segmented analysis surfaces them.
Explore member engagement metrics to understand how engagement data feeds directly into retention outcomes.
Member engagement KPIs and satisfaction measurements
Engagement is the leading indicator of renewal. A member who attends events, uses their benefits, and logs in regularly is far less likely to cancel than one who signed up and never returned. The challenge is translating “engagement” from a vague concept into numbers you can act on.

Member engagement can be measured by visits, event participation, and benefit utilisation to indicate likelihood of renewal. A practical starting point is total member visits divided by total active members, which gives you a clear engagement ratio to track month on month.
Engagement and satisfaction metrics to track:
- Visit frequency — how often members log into your portal or website. Declining visit frequency is an early warning sign of disengagement, often visible weeks before a cancellation.
- Benefit utilisation rate — what percentage of available benefits does the average member actually use? Low utilisation suggests members do not perceive sufficient value, which drives churn.
- Event attendance rate — tracking the percentage of members attending at least one event per year, alongside actual attendance numbers, informs your programming decisions. Virtual events have expanded reach considerably for UK membership bodies since 2020.
- Educational programme participation — for associations offering CPD or training, completion rates and course enrolment numbers indicate how members value your knowledge offering.
- Net Promoter Score (NPS) — ask members: “How likely are you to recommend us to a colleague?” on a 0–10 scale. NPS and Customer Satisfaction Score (CSAT) provide qualitative feedback explaining why members stay or leave, complementing your quantitative data.
- Exit survey responses — when a member cancels, a short exit survey captures the reason. Even a 20% response rate generates enough data to identify recurring issues in your programme.
- Qualitative feedback — structured focus groups or open-ended survey questions reveal nuance that scores alone cannot. A member who rates you 7/10 but writes “the events are excellent but the online portal is confusing” has given you a clear priority.
For practical strategies on improving member engagement, the relationship between engagement frequency and renewal probability is well documented.
How Colossus helps UK membership organisations track and act on KPIs
Tracking fifteen or more KPIs manually across spreadsheets is not just inefficient; it introduces errors and delays that cost you the ability to act while there is still time. The organisations that consistently outperform through data-driven adjustments are those with systems that surface the right numbers automatically.
Colossus is a SaaS platform built specifically for membership organisations, integrating the tools needed to track, analyse, and act on KPIs within a single system. Rather than stitching together separate tools for CRM, event management, email marketing, and payment processing, Colossus brings these functions together so your data is consistent and your reporting is reliable.
Key capabilities relevant to KPI tracking:
- Customisable KPI dashboards — configure your dashboard to surface the metrics that matter most to your organisation, whether that is churn rate, event attendance, or monthly recurring revenue.
- CRM with segmentation — segment members by tier, join date, geography, or engagement level to run targeted retention campaigns and track results by cohort.
- Event management — track registration, attendance, and post-event satisfaction in one place, connecting event data directly to member engagement scores.
- Email marketing and communication — measure open rates, click-through rates, and campaign-driven conversions as part of your member acquisition and retention reporting.
- Secure payment integration — track revenue by membership tier, monitor renewal payment success rates, and identify failed payments before they become unintentional churn.
- Analytics tailored for UK membership management — the platform’s reporting tools are designed for the specific needs of associations, charities, and professional bodies operating in the UK.
Understanding how data analytics unlocks membership growth is central to what Colossus is built to support.
Pro Tip: Schedule a quarterly KPI review using your Colossus dashboard. Compare current figures against the same quarter in the previous year, not just the previous month, to account for seasonal patterns in membership renewals and event cycles.
Good analytics also supports user engagement for lasting growth, a principle that applies as much to membership bodies as to any digital product.
Why trial retention deserves its own KPI
If your organisation offers a trial membership, a free introductory period, or a reduced-rate first month, trial retention is one of the most revealing metrics you can track. It measures the percentage of trial participants who convert to full paying members, and it exposes the gap between your acquisition messaging and your actual member experience.
A high trial sign-up rate paired with a low conversion rate is a specific diagnosis: your marketing is working, but your onboarding or early value delivery is not. Conversely, a modest trial sign-up rate with a strong conversion rate suggests your messaging is too cautious, and that the members who do try your offering find it compelling.
Track trial retention by:
- Conversion rate from trial to paid — the primary metric; track it monthly and by the channel that drove the trial sign-up.
- Average time to convert — how many days does a typical trial member take to upgrade? A long conversion window may indicate uncertainty about value.
- Trial churn rate — what percentage of trial members cancel before converting? Segment this by acquisition source to identify which channels bring in lower-quality leads.
- Onboarding completion rate — did the trial member complete your welcome sequence, access key benefits, or attend an introductory event? Completion of onboarding steps correlates strongly with conversion.
Average time to onboard new members is a related metric worth tracking even outside trial programmes. The faster a new member reaches their first meaningful interaction with your organisation, the more likely they are to renew. Organisations that use digital tools to track membership growth can automate onboarding sequences and measure completion rates without manual follow-up.
Colossus gives your membership organisation a measurable edge
Most membership organisations are sitting on data they are not using. Renewal patterns, engagement drop-offs, event attendance trends — the signals are there, but without the right platform, they stay buried in spreadsheets and disconnected systems.
Colossus is built for exactly this situation. Our membership management software brings together CRM, event management, email marketing, analytics, and secure payment processing in one place, so your KPI data is always current, always connected, and always ready to act on. Whether you are tracking churn across membership tiers, measuring NPS after your annual conference, or monitoring trial conversion rates from a new campaign, Colossus surfaces the numbers you need without the manual effort.
UK membership bodies using Colossus can configure dashboards to their specific metrics, segment members for targeted retention campaigns, and connect event management data directly to engagement scores. The result is a clearer picture of your organisation’s health and a faster path from insight to action.
Book a demonstration at colossus.systems/features to see how our platform fits your organisation’s specific KPI requirements.
Key takeaways
Tracking the right membership success metrics consistently is the single most reliable way to improve retention, grow revenue, and make confident strategic decisions for your organisation.
| Point | Details |
|---|---|
| Track across five domains | Cover financial health, acquisition, retention, engagement, and satisfaction to get a complete picture. |
| Segment your KPI data | Aggregate numbers hide patterns; segment by membership tier, join date, or geography to find the real story. |
| Trial retention reveals onboarding gaps | A high trial sign-up rate with low conversion points to a gap between your marketing promise and early member experience. |
| Engagement predicts renewal | Visit frequency, benefit utilisation, and event attendance are leading indicators of whether a member will renew. |
| Colossus centralises KPI tracking | Colossus brings CRM, event management, analytics, and payments into one platform so your membership data is always connected and current. |