The role of analytics in fundraising: a UK guide

TL;DR:
- Data-driven fundraising helps UK membership organizations boost retention, optimize asks, and improve event participation. Starting with five core KPIs and audience segmentation enables small teams to make consistent, ethical decisions that drive revenue growth. Leadership support and simple pilots turn analytics into sustainable, long-term success.
Analytics turns member behaviour into repeatable decisions that increase donor retention, average gift size, and event attendance. For UK membership organisations facing tighter fundraising margins and declining participation, data-driven fundraising strategies are no longer a luxury. They are the difference between guessing and knowing.
- Higher retention: identify at-risk members before they lapse and trigger automated stewardship sequences.
- Smarter asks: use giving history and engagement signals to match the right ask amount to the right person.
- Better event conversion: segment your invite list by past attendance and click behaviour to lift registration rates.
Pro Tip: Start with one dashboard showing five metrics: conversion rate, average gift, renewal rate, event registration conversion, and email click rate. Review it weekly for 30 days before adding anything else.
Table of Contents
- Why analytics matters now for UK membership organisations
- Which fundraising metrics should you track first?
- How does advanced segmentation increase fundraising revenue?
- A 4-step framework to make analytics drive fundraising decisions
- What tools and data sources do you need to connect?
- How should your dashboard and reporting cadence look?
- GDPR, ICO guidance, and ethical considerations
- Implementation checklist, costs, and a 90–180 day timeline
- Key takeaways
- Why sustainable analytics starts with leadership, not software
- Colossus Systems: CRM, events, and analytics in one place
- Useful sources and further reading
Why analytics matters now for UK membership organisations
UK nonprofits face falling donation participation, and the organisations responding most effectively are using analytics proactively to understand donor motivations and refine outreach. Analytics changes fundraising from guesswork to repeatable decisions.
The Marts&Lundy Fundraising Investment Study shows organisations increasingly adopt analytics for investment decisions, citing peer benchmarking and ROI metrics when arguing for resources internally. That shift matters for membership managers because it reframes analytics as a business case tool, not just a reporting function.
Practical gains are concrete:
- Targeted stewardship sequences improve member renewal rates by focusing effort on lapsed or at-risk cohorts.
- Segmented event invitations, sent only to members whose engagement history suggests interest, consistently outperform blanket mailouts.
- Volunteer conversion improves when behavioural data identifies members who attend events but have never been asked to volunteer.
Which fundraising metrics should you track first?
Track a small set of high-impact KPIs rather than everything. Fundraising analytics is most effective when dashboards answer decisions, not when teams drown in vanity metrics.
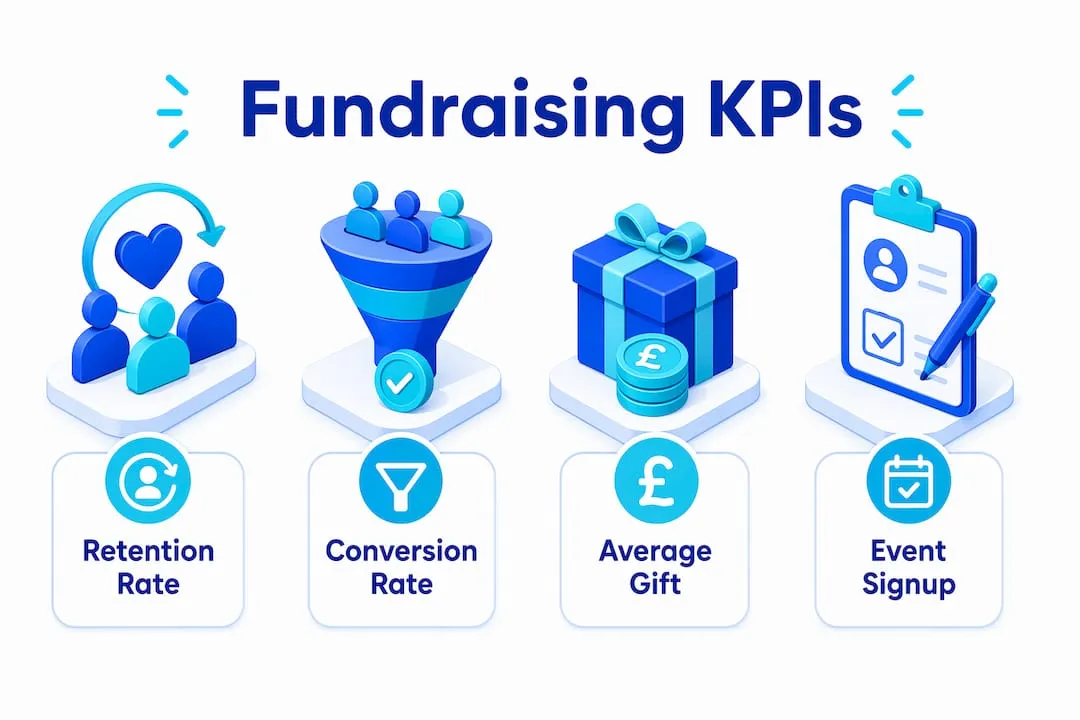
Core KPIs for membership organisations:
- Conversion rate: percentage of prospects who donate or register for an event.
- Average gift size: total revenue divided by number of gifts in a period.
- Donor/member retention rate: percentage of last year’s donors who gave again this year.
- Lifetime value (LTV): average gift × average giving frequency × average donor lifespan.
- Event registration conversion: registrations divided by invitations sent.
- Email engagement: open rate and click-to-open rate per campaign.
- Regular-giver churn: percentage of recurring donors who cancelled in a period.
| KPI | Simple formula | Next action if it drops |
|---|---|---|
| Retention rate | (Donors this year ÷ donors last year) | Launch a stewardship cohort for lapsed members |
| Average gift | Total revenue ÷ number of gifts | Test an upgraded ask amount for mid-level donors |
| Event registration conversion | Registrations ÷ invitations sent | Segment invite list by past attendance |
| Email click-to-open rate | Clicks ÷ opens | A/B test subject lines and send times |
Each metric points to a named next action. That connection between number and decision is what separates a useful dashboard from a reporting obligation.
How does advanced segmentation increase fundraising revenue?

Micro-segments and propensity models let you contact fewer people and achieve higher returns. Advanced donor segmentation beyond simple gift-amount groups, using giving history, engagement data, and predictive signals, can materially increase campaign revenue.
RFV segmentation (recency, frequency, value) combined with engagement triggers creates five to seven operational segments your team can act on immediately:
- Lapsed reactivators: gave 13–24 months ago, no recent engagement. Send a re-engagement sequence with a lower ask and a mission update.
- Recurring builders: active monthly givers with no upgrade in 12 months. Trigger an upgrade ask after a positive event interaction.
- Event-activated prospects: attended two or more events but have never donated. Invite them to a giving moment tied to an upcoming event.
- High-value stewardship: top 20% of donors by LTV. Assign to personal outreach, not mass email.
- Volunteer converters: members who attend events and open every email but have never volunteered or given. A targeted ask with a specific role converts this group well.
A practical test: take your event-activated prospects, send a personalised post-event appeal within 48 hours of attendance, and compare conversion against your standard appeal cadence. The difference in response rate will make the case for segmentation internally.
A 4-step framework to make analytics drive fundraising decisions
The JMIR Medical Education viewpoint recommends a four-step data-driven approach with ethical guardrails. For membership organisations, that translates directly into a 30–90 day cycle.
- Collect: connect your CRM, event registration platform, payment gateway, and email tool so data flows into one place. Assign one person to own data quality.
- Analyse: run a weekly review of your five core KPIs. Flag any metric that has moved more than 10% week-on-week and note the likely cause.
- Set SMART goals: translate findings into specific targets. Example: increase 90-day member renewal rate from 62% to 70% by [date] or lift event registration conversion from 18% to 25% within the next campaign cycle.
- Act and test: launch one targeted campaign per segment. Use a holdout group of 10–15% to measure true uplift. Report results to the board monthly.
Role assignment:
- Data owner: manages CRM hygiene and integration feeds.
- Campaign lead: runs segmentation tests and interprets results.
- Board reporter: presents monthly KPI summary with one recommended decision.
Pro Tip: Pilot one segment and one dashboard widget in the first 30 days. Compounding benefits build from that first proof point, and leadership buy-in follows measurable results.
What tools and data sources do you need to connect?
Connect your CRM, event platform, payment gateway, and email tool for a single source of truth. That integration pattern is the foundation of all-in-one nonprofit platforms and the fastest route to reliable insight.
Integration priority order:
- First: CRM to email platform. This single connection enables segmented sends and tracks engagement against donor records.
- Second: Payment gateway to CRM. Every transaction updates giving history automatically, removing manual entry errors.
- Third: Event registration to CRM. Attendance data feeds segmentation and triggers post-event appeals.
- Fourth: Behavioural tracking (website, survey responses) to CRM. This unlocks propensity scoring and channel-preference signals.
Colossus Systems brings CRM, event registration, email marketing, payment gateway integration, and analytics dashboards into one platform built for membership organisations. Rather than stitching together separate tools, your team works from a single data environment where every member interaction, event registration, and donation is visible end-to-end. That unified view is what makes weekly KPI reviews and automated stewardship sequences practical for small teams.
How should your dashboard and reporting cadence look?
A compact dashboard should answer three decisions: who to focus on, who to engage, and what to do next. Keep it to eight widgets maximum.
Sample dashboard layout:
- Retention panel: renewal rate trend (13-week rolling), at-risk member count.
- Revenue panel: average gift trend, recurring-giver churn rate.
- Event panel: registration conversion per event, post-event donation rate.
- Email panel: click-to-open rate by segment.
| Cadence | Metrics reviewed | Reviewed by |
|---|---|---|
| Weekly | Conversion rate, email engagement, event registrations | Campaign lead |
| Monthly | Retention rate, average gift, LTV, recurring churn | Management team |
| Quarterly | Full KPI set, A/B test results, segment performance | Board |
For A/B testing, always hold out 10–15% of a segment as a control group. Report the uplift (difference in conversion between test and control) rather than the raw response rate. That single habit prevents false positives from skewing your strategy.
GDPR, ICO guidance, and ethical considerations
Analytics must be legal and ethical. The ICO’s guidance on UK GDPR sets clear obligations for any organisation using personal data for fundraising purposes.
GDPR checklist for fundraising analytics:
- Lawful basis: document whether you rely on legitimate interests or consent for each data processing activity. Fundraising appeals often use legitimate interests, but this requires a balancing test.
- Transparency: your privacy notice must explain that you use data for analytics and personalised fundraising.
- Data minimisation: collect only what you need. If a field does not feed a decision, do not collect it.
- Retention: set and enforce deletion schedules. Donor records should not sit indefinitely in your CRM.
- Profiling safeguards: if you use predictive scoring or automated segmentation, members have the right to object. Make that process easy to find.
Avoid batch-and-blast sending entirely. Beyond the ethical issues, it suppresses deliverability and inflates your unsubscribe rate. Use channel-preference signals from your CRM to contact members on the channel they actually respond to.
Pro Tip: When using behavioural profiling for fundraising, add a one-line consent note to your next renewal communication: “We use your engagement history to personalise our communications. You can update your preferences at any time.” This satisfies transparency obligations and tends to reduce opt-outs.
Implementation checklist, costs, and a 90–180 day timeline
A phased approach reduces risk. Pilot one segment and one dashboard first, then scale what works.
Implementation checklist:
- Audit existing data sources (CRM, email, events, payments) and identify gaps.
- Select and connect your integration priority stack (CRM → email → payments → events).
- Build your five-KPI dashboard and set a weekly review cadence.
- Define your first micro-segment and write one targeted campaign.
- Set SMART goals, launch with a holdout group, and report results at 30 days.
- Scale to three to five segments at 90 days based on pilot results.
| Phase | Timeline | Typical effort |
|---|---|---|
| Discovery and audit | Weeks 1–2 | 4 staff hours; no software cost |
| Integration and dashboard build | Weeks 3–6 | Platform subscription + 8 hours setup |
| Pilot campaign (one segment) | Weeks — | 4–6 hours per campaign cycle |
| Scale to full segment set | Weeks — | Ongoing; 2–4 hours weekly |
Software costs vary by platform and organisation size. For small to medium membership organisations in the UK, an integrated platform typically costs less than maintaining separate CRM, email, and event tools individually.
Key takeaways
Analytics converts member behaviour into repeatable fundraising decisions that improve retention, average gift size, and event participation across every campaign cycle.
| Point | Details |
|---|---|
| Start with five KPIs | Track conversion rate, average gift, renewal rate, event registration conversion, and email click rate weekly. |
| Use the 4-step cycle | Collect, analyse, set SMART goals, act and test — repeat every 30–90 days. |
| Segment before you send | RFV micro-segments reduce wasted outreach and lift response rates across appeals and events. |
| GDPR is non-optional | Document your lawful basis, minimise data collection, and make profiling opt-outs easy to find. |
| Colossus unifies the stack | Colossus Systems connects CRM, events, email, and payments in one platform, making weekly analytics practical for small teams. |
Why sustainable analytics starts with leadership, not software
The organisations that get lasting results from analytics are not the ones with the most sophisticated tools. They are the ones where a manager reviews five numbers every Monday morning and makes one decision based on what they see. Software accelerates that habit; it does not replace it.
Starting small is not a compromise. A single well-defined segment, one dashboard, and a 30-day pilot will generate more useful evidence than a six-month implementation project that tries to do everything at once. The compounding effect of retention-focused analytics, where each renewal cycle builds on the last, means that even a modest improvement in renewal rate creates meaningful revenue growth over three to five years. Leadership buy-in follows proof, not promises. Bring your first pilot result to the board with a clear ROI calculation and the conversation about investment becomes much easier.
Colossus Systems: CRM, events, and analytics in one place
Membership organisations managing fundraising and events across disconnected tools spend more time reconciling data than acting on it. Colossus brings CRM, event management, email marketing, payment processing, and analytics dashboards into a single platform, so your team spends less time on data admin and more time on member relationships.
Key capabilities relevant to the framework in this article:
- Integrated CRM with giving history, engagement tracking, and segmentation built in.
- Event registration and ticketing with attendance data feeding directly into member records.
- Email marketing with segmented sends, A/B testing, and click tracking linked to donor profiles.
- Analytics dashboards showing KPIs across membership, events, and fundraising in one view.
- Payment gateway integration for secure, automated transaction recording.
If you are ready to connect your data and run your first segmented campaign, explore Colossus’s platform features or view the event management tools to see how it fits your organisation’s needs.
Useful sources and further reading
These sources underpin the guidance in this article and are worth bookmarking when building an internal business case for analytics investment.
- Data-driven fundraising: strategic plan for medical education (JMIR Medical Education) — the four-step framework and ethical guardrails for predictive analytics.
- Study: how data is reshaping fundraising investment decisions (NonProfit PRO / Marts&Lundy) — sector adoption rates and the business case for analytics investment.
- Driving impact through data: fundraising analytics in the not-for-profit sector (Simpson Associates) — UK-specific context on falling donor participation and analytics as a response.
- Fundraising analytics: 20 critical metrics and how to use them (Dataro) — practical metric selection and decision-driven dashboard guidance.
- Donor analytics (Meyer Partners) — segmentation approaches and their impact on campaign revenue.
- ICO: UK GDPR guidance and resources — the primary reference for lawful basis, transparency, and profiling obligations in the UK.
When presenting a business case internally, cite the Marts&Lundy study for sector benchmarking, the JMIR framework for methodology credibility, and the ICO guidance to address any governance concerns from your board.