Engagement metrics for associations: 2026 guide

TL;DR:
- Associations should measure multiple engagement indicators, including participation, digital activity, volunteerism, learning, and community connection, to accurately predict member retention. Building a weighted scoring model based on these metrics and leveraging integrated technology enables proactive outreach and strategic decision-making. Continuous monitoring and aligned data collection help associations improve member loyalty, increase renewals, and demonstrate value to sponsors effectively.
Most associations track attendance. Some track renewals. A small number track both and call it a day. But relying on those two numbers alone to judge association member engagement is like reading only the first and last page of a book and claiming you understand the plot. The engagement metrics for associations that actually predict retention, programme impact, and long-term sustainability go much deeper. This guide shows you how to measure what genuinely matters, build a scoring model your team can act on, and use technology to turn raw data into decisions.
Table of Contents
- Key takeaways
- Why engagement metrics matter to associations
- Core categories of member engagement metrics
- Building an engagement scoring model
- Using technology to measure engagement analytics
- Practical steps to improve your metrics programme
- My perspective on where associations get this wrong
- How Colossus supports association engagement tracking
- FAQ
Key takeaways
| Point | Details |
|---|---|
| Go beyond attendance | Participation rates, portal logins, and volunteer hours reveal far more about member loyalty than headcounts alone. |
| Build a scoring model | Weighted engagement scores across multiple dimensions let you identify at-risk members before they lapse. |
| Tie metrics to retention | Organisations scoring above 70% in engagement see renewal rates exceeding 90%, making measurement directly revenue-relevant. |
| Use integrated technology | Combined LMS, CRM, and member portal data gives a full picture that fragmented tools cannot provide. |
| Act on data continuously | Regular reporting cadences and member feedback loops turn metrics from a reporting exercise into a retention strategy. |
Why engagement metrics matter to associations
Engagement has replaced membership growth as the primary indicator of association sustainability. That shift happened because raw membership numbers can mask serious problems. An organisation might show steady headcount while quietly haemorrhaging its most active members, a trend that only becomes visible through engagement performance indicators.
The financial case is straightforward. Acquiring a new member costs 5 to 7 times more than retaining an existing one, and a 5% improvement in retention can lift lifetime member revenue by 25 to 40%. That means every percentage point of engagement improvement carries real monetary weight.
Engagement data also changes your value proposition to sponsors. Sponsorship investments are increasingly tied to session participation and digital activity, not just member counts. 61% of associations cite non-dues revenue growth as a top challenge, and showing sponsors detailed engagement analytics is one of the most credible ways to justify partnership investment.
Members attending at least one event per year are 3 times more likely to renew, while members who use two or more association benefits renew at twice the rate of those who use just one. Those numbers alone justify building a proper engagement measurement programme.
Community strength matters too. Associations with higher engagement tend to attract better speakers, stronger volunteers, and more referral-driven new members. Engagement feeds itself when measured and managed well.
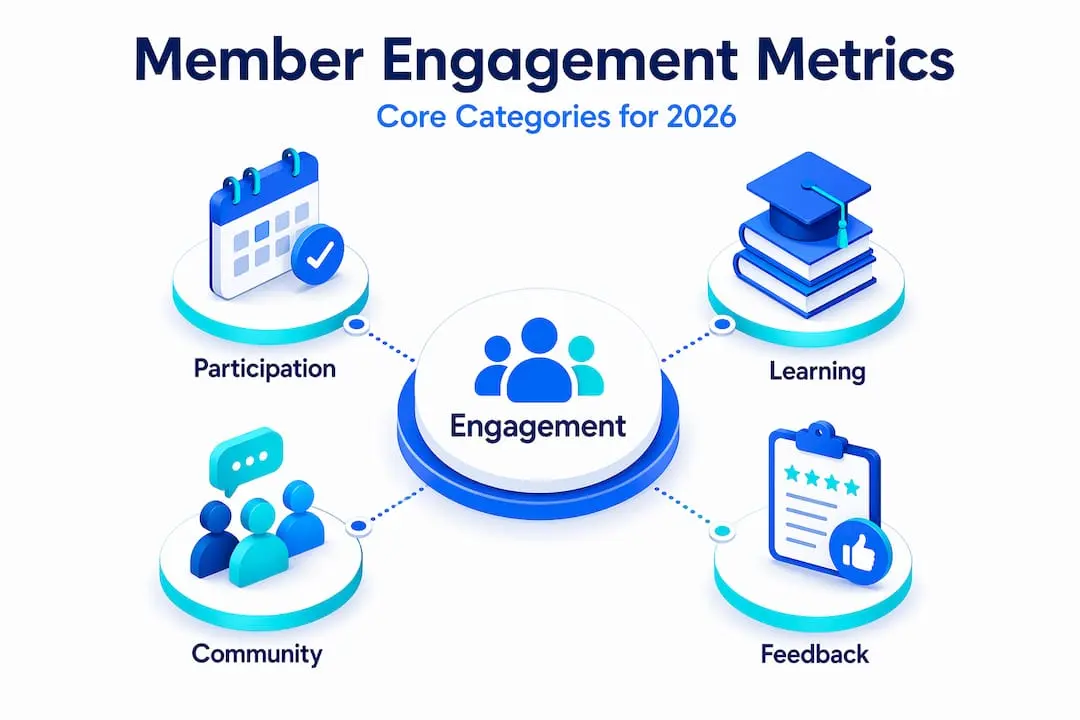
Core categories of member engagement metrics
Association participation metrics span a wide range of member behaviours. Grouping them into categories helps you track each dimension consistently and spot where individual members or cohorts are falling short.
Here are the five core categories worth measuring:
- Participation metrics: Go beyond raw attendance. Track which session types members attend, whether they attend in person or virtually, how frequently they participate across the year, and whether they show repeat attendance at flagship events. A member attending three niche workshops tells a very different story from one who appeared at the annual conference once.
- Digital metrics: Portal login frequency, content downloads, email open and click rates, forum posts, and community replies all reveal how members engage between events. Portal users renew at 92% compared to 65% for non-users. That 27-point gap makes digital activity one of the highest-signal metrics available.
- Volunteerism and advocacy metrics: Volunteer hours logged, committee roles held, speaking submissions, and member referrals are strong relational engagement indicators. Volunteers renew at 10 to 15% higher rates than non-volunteers, and they generate referrals that reduce acquisition costs.
- Learning engagement metrics: Course enrolments, module completions, certification attempts, and assessment scores are increasingly important as associations expand their education offerings. Members taking three or more courses annually renew at 89% versus 67% for those who do not participate in learning programmes at all.
- Community connection metrics: Profile completeness, mentorship programme participation, peer connections made through the platform, and directory usage all signal how invested a member is in the community itself, not just the transactional benefits.
Here is a quick comparison of how these categories differ in what they reveal:
| Metric category | What it measures | Retention signal strength |
|---|---|---|
| Participation | Event and programme involvement | High |
| Digital activity | Between-event engagement habits | Very high |
| Volunteerism | Relational and advocacy depth | High |
| Learning | Educational investment | High |
| Community connection | Belonging and peer relationships | Moderate to high |
No single category tells the full story. The associations that get the most from measuring association engagement are those that combine signals across all five.
Building an engagement scoring model
Collecting metrics is only half the work. Turning them into a score your team can act on is where most associations either get it right or lose the thread entirely.
A weighted scoring model works by assigning points to specific behaviours based on their predictive value for renewal. Here is how to construct one:
- List your trackable behaviours across all five metric categories. Be specific. “Attended an event” is too broad. “Attended two or more events in the past 12 months” is measurable.
- Assign point values based on correlation with renewal. Digital portal logins and event attendance tend to carry the highest weights. Community connection metrics may carry moderate weight. Use your own renewal data to calibrate this over time.
- Set a maximum score (100 is standard) and define engagement tiers. A common framework looks like this:
- Champion (75 to 100): Highly active across multiple categories. Prioritise for volunteer recruitment and peer advocacy.
- Active (50 to 74): Engaged but with gaps. Target with personalised programme recommendations.
- At-risk (25 to 49): Low recent activity. Trigger a proactive outreach sequence immediately.
- Lapsed (0 to 24): Minimal engagement. Requires direct intervention or win-back campaign.
- Monitor distribution shifts monthly. If your percentage of at-risk members is growing, you need to act on programming or communication before renewals suffer.
- Automate outreach triggers. When a member drops a tier, your CRM should automatically flag them for personalised contact. This is where CRM tools for member engagement become genuinely valuable rather than just administrative.
Pro Tip: Members completing structured onboarding sequences are 2.5 times more likely to renew in their first year. Weight onboarding completion heavily in your scoring model for new members specifically, then adjust the weightings after year one to reflect broader engagement behaviours.
Engagement scoring also changes the conversation inside your organisation. Instead of asking “are renewals up?”, your team starts asking “which members dropped a tier this month and why?” That question leads to faster, more targeted responses.

Using technology to measure engagement analytics
Fragmented tools create fragmented data. An association using one platform for events, another for email, and a spreadsheet for volunteers will never get a reliable picture of how engaged each member actually is. The data simply cannot be aggregated in any meaningful way.
Integrated platforms solve this by pulling behaviour data from multiple touchpoints into a single member record. The benefits are significant:
- Event app and registration data capture not just attendance but session-level participation, networking activity, and post-event content access.
- LMS analytics identify exactly where members drop off in learning programmes, allowing you to fix content or pacing issues before they affect completion rates. Integrated LMS and AMS systems improve retention prediction accuracy by 25% by giving a full engagement picture rather than isolated data points.
- CRM dashboards consolidate email engagement, event history, volunteer activity, and portal logins into a single view per member. This is what makes personalised outreach at scale actually feasible.
- Member portal analytics track login frequency, content consumption, and peer interaction, which are some of the strongest predictors of renewal available.
The challenge is data quality, not data quantity. Associations often collect far more information than they ever interpret. The best practice is to start by agreeing on which five to eight metrics matter most to your mission and renewal goals, and build your reporting around those before adding complexity.
Pro Tip: Micro-surveys immediately after interactions yield far more useful feedback than lengthy annual questionnaires, and higher survey participation correlates with 15 to 20% higher renewal rates. Build short post-event and post-course surveys directly into your member portal workflow.
For a deeper look at how engagement software supports associations, the technology options now available make comprehensive tracking genuinely accessible even for smaller teams.
Practical steps to improve your metrics programme
Having the right metrics framework means little without a clear process for implementing and refining it. Here is how to get your programme off the ground and keep it moving forward:
- Define your engagement goals first. Every metric you track should connect to something your association is trying to achieve. If your mission includes professional development, learning engagement metrics should feature prominently. If community building is central, prioritise community connection and volunteerism data.
- Select metrics based on what you can actually measure now. Start with the data you already have access to and build from there. Trying to implement all five metric categories simultaneously is a reliable way to stall entirely.
- Set a reporting cadence and stick to it. Monthly executive summaries with quarterly deep dives tend to work well. Share different views with different stakeholders. Your board needs tier distribution trends. Your programming team needs session-level data.
- Integrate member feedback as a formal input. Quantitative scores tell you what is happening. Qualitative feedback tells you why. Use both to inform decisions about content, events, and member services.
- Review and refine your scoring weights annually. As your organisation changes and your data matures, the relative importance of individual metrics will shift. Treat your engagement scoring model as a living document, not a fixed formula.
For associations working through this process step by step, reviewing a structured framework for measuring engagement effectiveness can help clarify sequencing and priorities.
My perspective on where associations get this wrong
I’ve seen association professionals pour genuine effort into building dashboards full of engagement data and still struggle to act on any of it. The problem is almost never the data itself. It is the absence of a clear decision framework sitting underneath it.
What I’ve found is that renewal rate alone is a lagging indicator. By the time a member does not renew, you have already missed at least six months of warning signals that a proper engagement score would have surfaced. The associations making real progress are the ones treating engagement scores as a member health metric, reviewed monthly, not just pulled out when renewal season arrives.
I’ve also learned that member-centric data requires member-centric technology. Bolting together three disconnected tools and hoping someone reconciles the exports in a spreadsheet is not a measurement programme. It is wishful thinking dressed up as analysis.
The most encouraging shift I’ve noticed recently is associations moving from annual measurement cycles to continuous monitoring. That change alone, from “how did we do last year” to “what is happening right now,” tends to produce better member experiences well before it produces better renewal numbers. Start small, measure consistently, and refine relentlessly. That approach outperforms any grand metrics overhaul every time.
— Rob
How Colossus supports association engagement tracking
Colossus brings together the tools associations need to track, analyse, and act on engagement data without cobbling together multiple disconnected systems. Our membership management platform captures behaviour across events, member portals, email campaigns, and learning programmes in a single record per member, giving your team a genuinely complete view of how each person is engaging with your organisation.
Our event management software goes beyond registration data, capturing session-level attendance, post-event content access, and networking activity so your event metrics actually reflect participation depth. Combined with built-in CRM capabilities and member engagement analytics, Colossus gives you the foundation to build engagement scores, automate outreach, and make data-driven decisions that retain members and grow your organisation.
FAQ
What are engagement metrics for associations?
Engagement metrics for associations are data points that measure how actively members participate in events, educational programmes, digital platforms, and community activities. They go beyond renewal rates to reveal member behaviour patterns that predict long-term retention and satisfaction.
How do you calculate a member engagement score?
A member engagement score is calculated by assigning weighted point values to specific member behaviours across categories such as event attendance, portal logins, volunteer hours, and course completions, then summing those points into a total score out of 100.
Which engagement metric best predicts member renewal?
Portal login frequency is one of the strongest renewal predictors available. Portal users renew at 92% compared to 65% for non-users, making digital platform activity a higher-signal metric than event attendance alone.
How often should associations review engagement data?
Monthly reviews of engagement tier distributions work well for operational decisions, with quarterly deep dives for programming and communications strategy. Annual reviews of your scoring model weights help keep the framework accurately calibrated as your member base evolves.
What technology do associations need to measure engagement effectively?
Associations benefit most from an integrated platform combining a member portal, LMS, CRM, and event management tools. Integrated LMS and AMS systems improve retention prediction accuracy by 25% compared to fragmented tools that cannot aggregate member data across touchpoints.